

So how do we cut through the noise to understand what is really going on? Looking at the day-to-day relative price movements for individual stocks and sectors would be a good place to start. However, the sheer quantity of data makes this a significant challenge. If we were to consider 20 years worth of daily history for a typical global equity index of around 10,000 stocks, we would need to consider 52 million individual data items before we could even begin our analysis. Very few investors would have the ability to sort through such an overwhelming amount of information by eye and draw meaningful conclusions. But this is just the start. What about valuation, quality and financial strength? All these characteristics are important and relevant for the logical analysis of a potential investment.
We therefore require a methodology that will enable us to process the available data set and interpret the information effectively. Quantitative analysis, or as we prefer to call it a ‘process driven’ investment approach, offers a powerful route to achieving this goal. Since quantitative analysis is computer-based, processing times are accelerated, meaning that a quantitative strategy can be far more reactive to opportunities than fundamental analysis. Quantitative techniques are therefore particularly well suited for investors dealing with Shariah benchmarks, given that the financial screening criteria used to create them will alter the set of investable companies every time the index is recalculated. More importantly though, quantitative techniques move us away from reacting to the latest Bloomberg headline, or being influenced by sound bite reporting of the media. Investment should be based upon a measured interpretation of the facts, and a quantitative investment process is designed from the outset to be unbiased and logical. The human mind is a great tool, but dispassionate information processing is not one of its strong points.
Our first step is to calculate a broad array of fundamental metrics, such as the price to earnings ratio (PER), revisions to analysts’ forecasts and measures of management efficiency such as return-on-equity (ROE) and combine them into investment ‘styles’, described as value, growth, momentum or quality. The financial metrics we use should not be a surprise to anyone, as a quantitative process is best described as an ‘expert system’. The measures are the same as those used for fundamental analysis, although the quantitative ‘expert’ is capable of analyzing gigabytes of information with total impartiality. We use correlation analysis to identify which metrics best predict share price performance within each economic sector around the world over a given time period, ensuring that our style definitions make sound economic sense. This approach helps ensure that our styles adapt to the prevailing economic environment, emphasising more ‘defensive’ measures of value such as dividend yield during periods of economic stress, and ‘growth’ measures such as return-on-equity during periods of economic expansion.
Having tailor made a relevant style for each of the 2,500 companies in our universe, we then address the question of style timing. It is one thing to have a range of coats for every season, but how do we pick the right coat? Normally one would look out of the window. We do a similar thing by analyzing in depth what is currently being reflected in the equity markets that we study. We extend our correlation analysis to understand which styles are most appropriate to the current market environment. By calculating the predictive power of each style over a chosen period of time, and combining this with the relevant style for each company, we can build up a picture of which companies offer the most compelling combination of the available investment styles. We call this proprietary stock selection model ‘cognition’, a computer-based ‘expert system’ which observes most of the indicators that traditional investors would analyse, but in a systematic, data-intensive way.
All fine in theory, but does it work in practice? The investment team at Reliance Asset Management Malaysia has been successfully running Shariah compliant portfolios for a number of years now. The WSF Reliance Global Shariah Growth Fund was launched in August 2010 and since launch it is the best performing Shariah compliant diversified global equity fund (Source: TrustnetMiddleEast, Bloomberg as of the 11th October 2011).
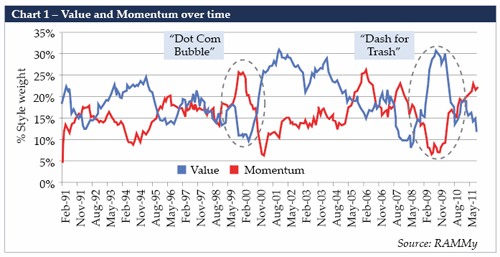
Before using cognition to assess the current market environment, it is worth looking at our style analysis in a historical context. Chart 1 depicts the historic average weights of value and momentum within the cognition model and two events stand out. First, towards the end of the ‘dot com’ bubble in 1999-2000, momentum became a particularly powerful investment style, as investors were prepared to ignore the level of a company’s earnings and even sales, in the hunt for the next big internet success story. Valuation was therefore less relevant as a style, since companies that were cheap relative to their peers were considered to be ‘old economy’ stocks, with inferior growth prospects. This situation reversed dramatically when the bubble burst in March 2000.
More recently, early 2009 witnessed another major event in style history, often referred to as the “dash for trash”. In response to the global financial crisis, central banks around the world implemented quantitative easing (QE), an unconventional form of monetary policy loosening involving the purchasing of financial assets from banks with newly created money. During 2008, investors had ignored valuation due to significant uncertainty over future earnings, instead of seeking the relative safety of more defensive companies, such as those demonstrating high levels profitability and low levels of share price volatility. However, in the wake of QE, another sharp style reversal took place, as investors rapidly moved back into low PE stocks, these being the most economically sensitive stocks that had been shunned at the height of the crisis.
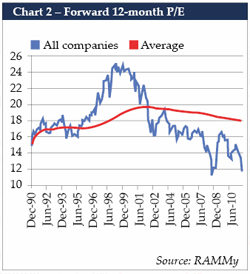
In terms of valuation, stock markets do look cheap relative to historic averages. We estimate that the 12-month forward PER for the S&P Developed BMI Index, at 11.7x, trades at a discount of around 35% to its historic average. The 12-month forward dividend yield of 3.7% is also high relative to the past, at a 46% premium to its historic average. There are clearly risks to the macro-economic outlook, and some level of discount is therefore warranted, but current valuation levels do appear to offer a reasonable margin of safety for investors prepared to take a long-term view.
Shariah indices have historically traded at a premium to the broader market, reflecting both their differing sector composition and the impact of financial screens, which remove companies with high levels of debt and receivables. In late 2009, Shariah stocks briefly traded at a discount to the market, and although the premium has been restored in recent months, as Chart 3 illustrates, the current discount remains below the historic average, adding an additional margin of safety for Shariah compliant investors.
Discounted equity valuations suggest investors remain cautious over the economic outlook, but they do not give the full story. By aggregating our style analysis across sectors and global markets, we can build a more detailed picture (Chart 4) of how investors have currently positioned themselves in response to economic events. We can see that value has underperformed as an investment style, as investors remain uncertain over the future direction of corporate earnings. Meanwhile growth and momentum have both gained ground over the last year, at the expense of the more defensive financial strength style. This is interesting as although equity market volatility indicates a great deal of uncertainty, investors are positioned for a resumption of growth not for a recession. The ‘real’ activity at the stock level has been in backing companies best positioned to benefit from a continuation of the recovery that we have experienced since 2009. In summary, the margin of safety in valuations leads us to believe that an exposure to global equities is justified and the overall style message from ‘cognition’, suggests a tilt towards high growth and momentum stocks hedged with allocation to financial strength for protection. Our current portfolio holds around 100 positions across 15 global markets that reflect these characteristics.


Ian Lancaster is the CEO and CIO of Reliance Asset Management (Malaysia). He can be contacted at
[email protected]
.