

Malaysia remains firmly ahead of its peers in Southeast Asia in terms of the development of Shariah compliant funds. Nonetheless, the industry has had to change over the years so that it could not only retain this lead but also respond to client demands for more diverse investment choices. It is the nature of this evolution that we seek to analyze, by looking at a wide range of metrics (from industry make-up to historical performance) of funds originating from this country.
Industry structure and size
Malaysia has well over 120 Islamic funds across all asset classes, which represent a considerable 22% of the total number of funds available worldwide (the total universe stands approximately at 550). This is even more substantial considering that there are roughly 40 other Islamic products in the rest of Asia-Pacific (most of these being based in Indonesia and, to a lesser extent, Singapore).
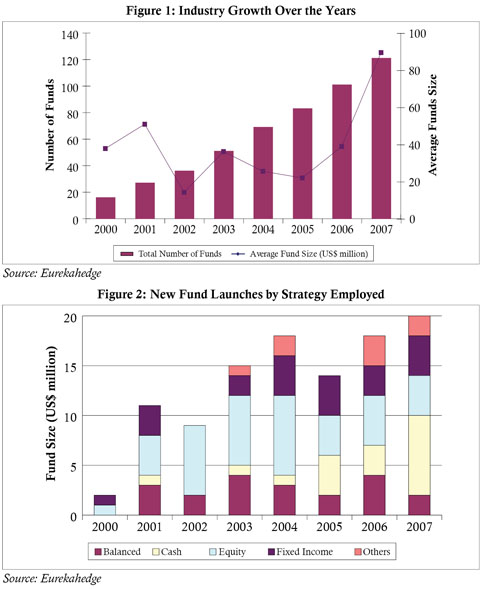
However, there has been a slowdown in the number of fund launches globally, in particular since the peak of 2006, but Malaysia has managed to buck this trend. In fact, 2007 has seen the greatest number of launches ever (over 21 so far this year), with a notable focus on money market funds (eight new launches in this category), as seen in Figure 2. More recently, this has also included forays into real estate and private equity vehicles, which are both accounted for in the “Others” category.
Asset allocation and track record
Equity funds retain the bulk of the attention both in terms of asset size (67% of all allocations) and number of funds (43% of all products offered), but the trend in the recent past has been to diversify into other asset classes.
The end result is evident from both Figure 3 in terms of asset allocations, and Figure 4 in terms of total number of funds offered. At first glance, it seems that money market and balanced funds do not appear to be as attractive to investors — they represent 33% of the total products offered but account for less than 13% of total assets.
What is not immediately observable is the gradual drift towards regional exposures as opposed to country-specific mandates. This would partially help explain the significant allocation into equity funds since these have moved away from being Malaysia-focused towards more pan-Asian mandates.
On the other hand, fixed income funds have been able to hold their ground with 13% of total assets captured in this category, despite some suggestions that their structure is not acceptable by non-Malaysian investors.
What still holds true — regardless of geographical mandate — is that a track record is as valuable as ever, and longevity does command higher asset sizes as shown in Figure 5. Hence funds launched in 2000 or earlier account for approximately US$700 million in assets, although vintage years like 2001 and 2002 clearly struggled.


Fees and Performance
The average management fees being charged by funds can be used as a measure of aggressiveness as well as competitiveness in the marketplace. Traditionally, older funds would be expected to charge higher fees as they stake a claim on experience and concrete track records, while young funds compete for assets with less tangible evidence and thus command lower fees (especially in crowded markets).
As seen in the table, this holds true for Malaysia across all asset classes (fixed income funds, for instance, have lowered their fees from 1% to 0.94%), with the exception of equity funds. The average management fee for these funds has increased from 1.5% to 1.75%, despite shorter track records and more funds being on offer. This can be explained by greater active management and more intensive equity research across a larger stock universe.
Although assets have grown consistently and a wider range of products is available to investors, the focus is now on differentiation. This has remained a challenge for fund managers as Figure 6 shows that the gap between top and bottom quartile returns has remained tight. Only in recent months has there been clear evidence of a breakout from this trend.

A comparison of monthly returns versus date of inception allows closer scrutiny of this. As might be expected, older funds exhibit a wider range of returns than their younger counterparts. Thus best and worst monthly returns are positively correlated to date of launch (i.e. older funds have experienced the best monthly returns as well as the worst monthly returns).
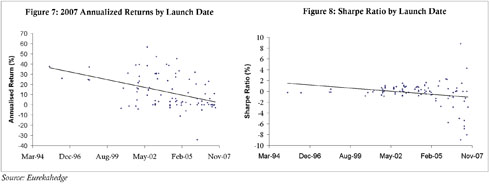
Annualized returns for 2007 solidify the notion that experience matters, as shown in Figure 7, with older funds having performed better this year during the recent market turmoil than their younger counterparts. The greater dispersion of returns for older funds also makes it easier to discern the top performers, while this remains difficult among younger funds.
In addition, the Sharpe ratios shown in Figure 8 suggest that pre-2005 launches offer a more stable risk-return profile, while younger funds attach a more aggressive stance to their offerings.
Conclusion
Malaysia remains a fast-developing market at the forefront of Islamic finance. In turn, several market participants have moved ahead to attract a new wave of investors and increase their product offerings accordingly (CIMB, for example, is becoming one of the first Islamic banks to offer universal banking solutions). The new wave of products seeks to succeed by catering to a wider investor base and a more aggressive appetite. It is their success that will spur more participants to join the fray and further encourage more innovative products into the market.
Bernardo Vizcaino is a research analyst at Eurekahedge, the world’s largest independent data provider and research house.